A stock predictor is only worth using if it says how wrong it can be and has been tested on your past.
For companies that restock many shops, customers, vans or warehouses and want to know, before the delivery leaves, which product will run out where. Our predictor is the engine inside the replenishment system: it estimates sales for each product and location, turns the estimate into a risk of running out, and from the risk works out how much to send. It is measured on your own history before anyone relies on it.
Book a 30-minute demoHow it works
Read-only connection · Tested on your own data first · Data hosted in the EU · Demos in English or Spanish
The short answer
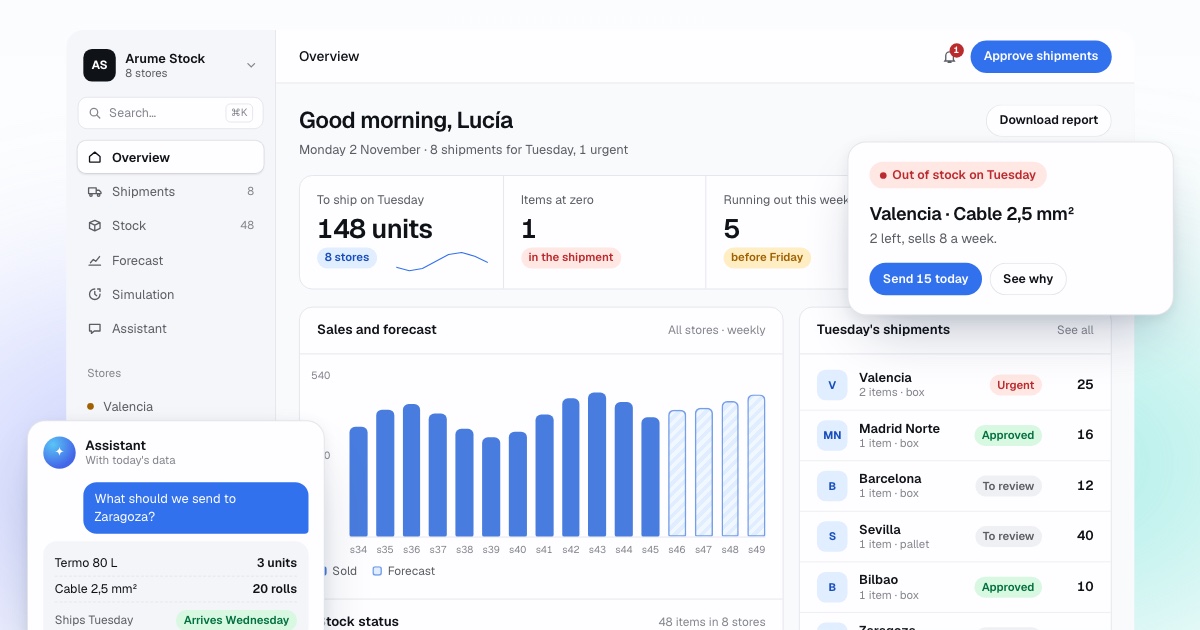
An AI stock predictor is software that estimates how much of each product will sell at each location over the coming weeks, gives the range in which that estimate can fall, and from the range calculates the probability of running out before the next delivery. Arume's predictor does this on top of your existing ERP, with read-only access, and is checked by backtesting on your past sales and then in shadow mode before it proposes real shipments.
By Manuel Gómez González, founder of Arume · Reviewed on
What it does
Sales forecast per product and location
One forecast for each product at each place, week by week, instead of a company total split by weight. A mixer tap that sells 12 a week in Valencia and 3 in Bilbao is two different problems, and the predictor treats them as two.
A range around every forecast
Not "14 units" but "most likely 14, and in eight weeks out of ten between 9 and 21". The range is what lets the system price the risk instead of guessing a safety margin.
Risk of a stockout
With today's stock, what is on its way and the supplier lead time, the predictor gives the probability that a product reaches zero before the next delivery. You choose how much risk you accept for each family.
How much to send and when
The risk becomes a proposal: product, location, quantity, date and the reason in one sentence. A person approves or changes each line. Nothing is written to your ERP without that approval.
Calibration you can read
When the predictor says "5 % risk", it should run out about 5 times in 100. We count it on your history, band by band, and show the table.
Slow sellers and gaps in the data
Items that sell twice a quarter are handled as probabilities, and days when a location sat at zero are flagged so that they are not read as "no demand".
What is an AI stock predictor?
It is software that predicts, for every product at every location, how much will be sold in the coming weeks, learning from your sales history with machine-learning models and statistical methods, and that states how far the prediction can be wrong. The output that matters is not the forecast itself but what it supports: the chance of running out and the quantity to send.
The names vary. People search for "inventory prediction software", "stock prediction software" or simply "stock predictor", and they can mean two things. Some mean a tool that predicts the price of shares. We mean the other one: predicting the stock a business holds, which is a question about sales, delivery times and risk, not about markets.
Our predictor is not sold on its own as a catalogue product. It is the engine of our inventory replenishment system, installed on the software you already run and tested on your data before you commit.
What does the predictor actually predict?
Three things, in this order. First, sales of each product at each location, week by week, with a range. Second, the risk of running out before the next delivery can arrive: the probability that sales over the lead time exceed the stock you have plus what is already on its way. Third, how much to send, which is the smallest quantity that brings that risk below the level you accept for the family.
Take a distributor of bathroom fittings with eight depots. A depot has 18 boxes of mixer taps, the supplier takes five working days and the forecast for those days is 14 boxes with a range from 9 to 21. The risk of running out is the probability that sales go above 18, which the range gives directly. If you accept 5 % for fast-moving lines and the risk comes out at 17 %, the predictor proposes a shipment and says why. If it came out at 3 %, it proposes nothing and the line does not appear.
What it does not predict is what has never happened in your data: a new large customer, a depot opening in a city with no history, a price change nobody mentioned. There it leans on similar cases and widens the range. If you know something that is not in the data, tell us and it goes into the calculation.
How do you know the predictor is right?
You do not take our word for it. There are three checks, and the first two happen before you decide anything.
The first is the backtest. We replay your past weeks: for each date the predictor sees only what was known that day, forecasts the following weeks, and we compare with what was really sold. This follows the standard time series cross-validation approach, in which the training data contains only observations before the one being forecast. We report weighted error in units, bias (whether it sits consistently above or below) and the comparison with a simple baseline, such as the average of the last weeks.
The second is calibration. A range is only honest if it holds up. For an 80 % interval, the actual value should fall below the lower limit about 10 % of the time and above the upper limit about 10 % of the time, which is how Hyndman and Athanasopoulos describe checking distributional forecasts. We count that on your history. If it said "10 % chance of selling more than this" and it happened 25 % of the time, the range is too narrow and the stock built on it would fall short.
The third is shadow mode: one or two months in which the predictor produces its weekly proposal with fresh data while you keep deciding as usual. At the end you compare what it proposed with what you did and what happened. Only then does it start proposing real shipments.
- Backtest on your past weeks, with only the information available each day.
- A simple baseline always alongside: where the model does not beat it for a group of products, the baseline is used for that group.
- Calibration table by band: promised risk against what really happened.
- One to two months in shadow mode before any proposal is used.
Is forecasting always better than a fixed minimum?
No, and we publish the evidence. In our open Replenishment study 2026, a simulation of 1,200 synthetic sales series, forecast-based replenishment needed 25 % less stock than fixed weeks of cover and 42 % less than a fixed minimum to serve 95 % of demand for seasonal products with a four-week lead time. With steady demand and a short lead time, a well-tuned fixed cover did just as well.
The data are synthetic and public, so this is not a customer result and not a promise for your company. It tells you where a predictor earns its place: long lead times, seasonality and irregular sales. Where demand is flat and the supplier is close, its main value is the early warning and the reason attached to each shipment, not less stock. We say so in the first call, because it changes what you should expect.
What data does it need?
Sales by product, location and date (daily or weekly), from Odoo, Microsoft Dynamics 365 Business Central, Sage, Holded, SAP Business One, Shopify, WooCommerce, PrestaShop, Power BI or an Excel or CSV export. Stock today and the movements in and out, so that we can rebuild the days a location had no product. Supplier lead times. Promotions with their dates, if you keep them. No customer data is needed.
One year of history is enough to start; with two, seasonality is seen twice and the ranges narrow. With less, the predictor starts from what product families share and flags low confidence line by line. Before forecasting anything we send you a data quality report: products with no sales, duplicate codes, weeks that do not add up.
- Product, location, date and quantity sold.
- Current stock and movements, or daily stock if you keep it.
- Lead time for each supplier.
- Promotions, price changes and product replacements, with dates.
What does it not do?
It does not place orders on its own, and it does not change your ERP. It reads with a user that cannot write, and every proposed shipment is approved or edited by a person. It does not guarantee that you will never run out: it tells you how likely it is, and you decide how much risk to accept. And it does not predict share prices, customer churn or anything outside sales, stock and replenishment.
If the predictor does not beat a simple rule on your data, we tell you that after the backtest, before you have spent anything on it.
How do we start?
With a 30-minute video demo, in English or Spanish. If you want a preview afterwards, send us an export of sales and stock and we return which products ran out, for how many days and how much demand was hidden behind those days. Set-up takes three to six weeks, and your data is hosted in the EU.
If you want the detail of the engine, read how demand forecasting is done in the system, or how a simulation with your own data works.
Frequently asked questions
Is this a tool that predicts share prices?
No. It predicts the stock a business holds: how much of each product will sell at each location and when it will run out. It has nothing to do with financial markets.
How accurate is it?
It depends on your sales, so we do not quote a figure in advance. We measure it on your own history with a backtest and report the error, the bias and whether the ranges are calibrated. That report is the answer.
What is the difference between this and the forecast in my ERP?
Most ERP forecasts give one figure per product, often for the whole company, based on a moving average or a fixed coefficient. The predictor forecasts each product at each location, gives a range, and converts it into the risk of a stockout and a quantity to send.
Does it work with few sales records?
Yes, with lower confidence. With less than a year of history it relies on what product families share and flags low confidence on each line, so you know which proposals to check by hand.
Can the predictor write orders into my ERP?
Not without approval. It proposes, a person approves or changes, and writing back is agreed case by case. Its connection is read-only by default.
Do you need our customers' personal data?
No. Product, location, date and quantity are enough. If an export contains names or addresses, they are removed before anything is loaded.
Sources
- Hyndman and Athanasopoulos, Forecasting: Principles and Practice (3rd ed.): time series cross-validation
- Hyndman and Athanasopoulos, Forecasting: Principles and Practice (3rd ed.): evaluating distributional forecast accuracy
- Hyndman and Athanasopoulos, Forecasting: Principles and Practice (3rd ed.): prediction intervals