Demand forecasting that is useful ends in an order: by product, by location and with its margin of error.
For companies that replenish many shops, customers, vans or warehouses and forecast today with a moving average in Excel or with a coefficient someone typed into the ERP. Our system forecasts each product at each location, week by week, with a range that says how wrong it can be, and from that range it works out what to send. You can test it on your history before deciding anything.
Book a 30-minute demoHow it works
Read-only connection · Tested on your own data first · Data hosted in the EU · Demos in English or Spanish
The short answer
AI demand forecasting software estimates how much of each product will be ordered at each location in the coming weeks, and says how far the estimate can be wrong. It learns from the whole catalogue at once, picks up seasonality by region and product family, and treats slow-moving items separately. From the forecast range comes the risk of a stockout, and from the risk comes what to send and how much. It is measured on your own history before it is used.
By Manuel Gómez González, founder of Arume · Reviewed on
What it does
One forecast per product, location and week
Not the company total split across shops by weight. Each product-location pair has its own pace, season and noise and is forecast separately: granular chlorine in a shop in Alicante does not move like it does in Girona, even when the monthly total matches. It is recalculated every week with the sales that just came in.
A range, not a single figure
Each forecast comes with its most likely value and a range: "the normal is 14 buckets; in nine weeks out of ten, between 9 and 21". From that range the system calculates the risk of running out before the next delivery, and from the risk you accept comes the quantity. The safety margin stops being set by eye.
Seasonality learned across the family
A product with two seasons of history is not enough to estimate its yearly curve. The model learns seasonality from all products and locations at once, so a newly listed item inherits its family's curve from week one.
Slow-moving demand treated as what it is
A pump that sells twice a quarter is not forecast with an average of 0.6 a week. For these items we estimate how often they sell and how many, as a probability, and the decision uses that risk, not a decimal nobody can ship.
Days without stock do not count as "does not sell"
We rebuild daily stock from your movements. Days when a location sat at zero are flagged and the demand behind them is estimated. This correction changes the forecast most on the products that run out most.
Promotions, holidays and price changes, with dates
A promotional week sells double and does not repeat. If your system stores promotions we read them; if not, the major ones are noted in the diagnosis. Local holidays and shop openings and closures also go in.
From forecast to the week's shipments
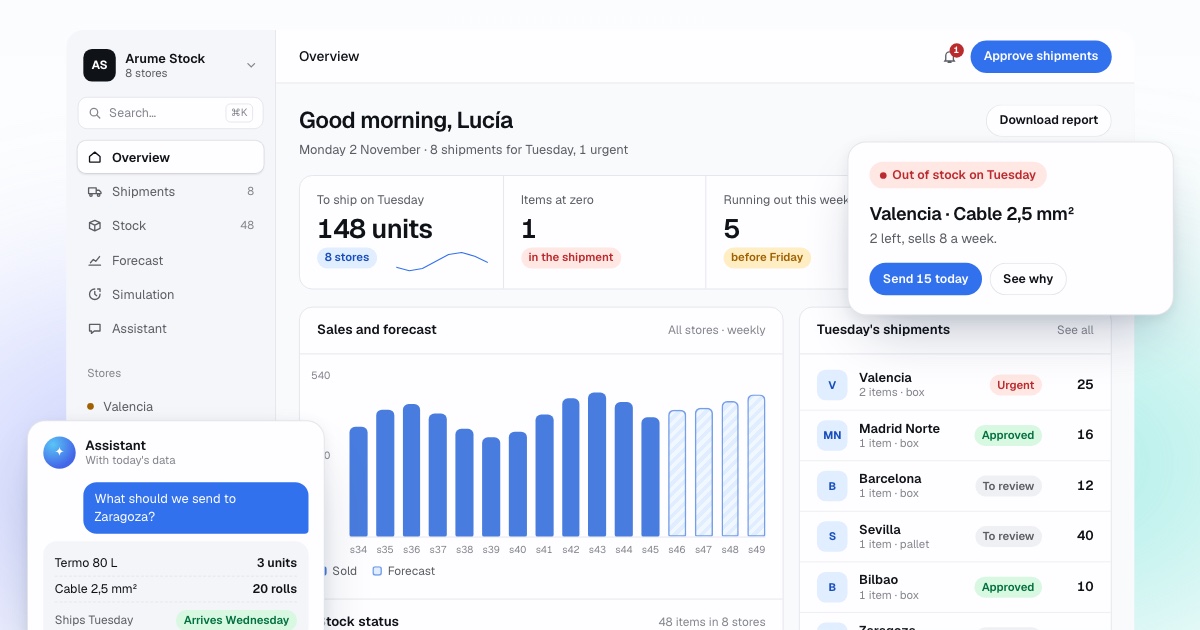
The forecast does not stay on a chart. With stock today, what is in transit and each supplier's lead time, the system proposes every Monday what to send where, with the reason. A person approves or changes it.
What is AI demand forecasting software?
It is software that estimates how much of each product will be ordered at each location over the coming weeks, learning from your sales history with machine-learning models, and that states how much that estimate can miss. The word that matters is "each": it does not forecast the quarter's revenue, it forecasts granular chlorine at one shop next week.
Classical methods (moving averages, exponential smoothing, seasonal indices) work for one product with a long history. They struggle when you have thousands of product-location series, most of them short and noisy. That is where models trained on all series together earn their place.
In our inventory system the forecast is one component, not the end product. What reaches the person who decides is the week's shipment list, and each line rests on a forecast with its range. You can test the forecast separately: if you only want to know how accurate it would be on your sales, the backtest measures it.
How do multi-location businesses forecast today?
Usually with a spreadsheet holding the last few weeks of sales, or an ERP module with a minimum and maximum per item fixed at implementation. It works as long as the business looks like it did when it was set up. It stops working in three places: seasonality, products with little history, and days when stock was missing.
Take a chain of eight irrigation and pool shops around the Mediterranean and the Balearic Islands. In March, the average of the last eight weeks says granular chlorine sells little, because nobody treats water in January and February. The Alicante shop runs out in the second week of April, Girona three weeks later, and the average catches up when the season is half over. In September it reverses: the average stays high and shops sit on buckets until spring.
An ERP module does not fix this if the seasonal coefficient is one for all shops. And items that sell now and then, such as a pool pump or a six-zone irrigation controller, end up with a minimum of one unit that is too much all year in some shops and too little in June in others.
Why train one model on the whole catalogue?
The basic difference from a spreadsheet is that the model does not learn product by product. It is trained on all product-location series together and extracts what they share: that the pool family starts earlier on the coast, that a local holiday brings purchases forward two days, that a newly arrived product takes a few weeks to find its pace. Each series then adjusts its own level with its own sales.
This approach has a public test. In the M5 forecasting competition, participants had to predict 42,840 series of Walmart unit sales, organised by product, store and state. The results article by Makridakis, Spiliotis and Assimakopoulos reports the outcome of that test; it is also a reminder that a complex model badly validated can lose to a simple one. That is why ours is always measured against a plain baseline on your history, and where it does not beat the baseline for a group of products, the baseline is used there.
- Sales for all products and locations in one model, with calendar, regional holidays and price.
- Each product-location level adjusted every week with new sales.
- Statistical methods for items with little history or sporadic sales.
- A simple baseline always alongside, so you know whether the model adds anything.
What is the forecast range and what is it for?
The range is the interval where sales are expected to fall with a given probability. Hyndman and Athanasopoulos put it plainly in their forecasting textbook: point forecasts can be of almost no value without the accompanying prediction intervals, because a single figure does not say how wrong it can be. Two products with a forecast of 14 can move one between 12 and 16 and the other between 4 and 30.
In the system the range has a concrete use. It gives the probability of running out before the next shipment arrives. If a shop has 18 buckets of chlorine, the shipment takes five days and the range for those five days runs from 9 to 21, the stockout risk is the probability that sales exceed 18. The system calculates it, compares it with the service level you set for that family and, if it is exceeded, proposes the shipment.
A range is only worth something if it is honest. It is checked on history: of all the times it said "there is a 10% chance of selling more than this", we count how many times it happened. If it was 25%, the range is too narrow and the stock based on it will fall short; if it was 2%, it is too wide and you are paying for stock you do not need. That check goes in the backtest report, band by band.
How is slow-moving or intermittent demand forecast?
Intermittent demand belongs to a product that goes many weeks without selling and then suddenly does: spare parts, expensive accessories, extreme sizes, a pump in a small shop. A weekly average of 0.3 cannot be shipped and hides what matters, which is when it will sell again and how many.
The classic method for these series is Croston's. The same textbook explains its limits: it does not properly deal with the count nature of the data and its forecasts are known to be biased. We treat these items as probabilities instead: how many weeks usually pass between one sale and the next, how many units go when one sells, and from that the probability of a sale before the supplier can deliver.
With that probability the decision stops being "one of everything everywhere". You see which items are worth holding at each location, which are better held centrally and sent when they sell, and which should be ordered from the supplier on demand. If an item is critical, it is flagged and given its own service level.
What data does it need?
Sales by product, location and day (or week) from whatever you use: Odoo, Business Central, Sage, Holded, SAP Business One, your online shop or an Excel export. Today's stock and the movements in and out, to rebuild which days there was product. Promotions with dates, if they exist. And product code changes: an item that replaced another must inherit its history, or the new one looks as if it does not sell and the old one as if it suddenly stopped.
With one year of history we can start; with two, seasonality is seen twice and the range narrows. With less, the system starts from what product families share and marks confidence as low on each line. Before forecasting anything we give you a data quality report: products with no sales, duplicate codes, locations with gaps, weeks that do not add up.
- Product, location, date and quantity. No customer data.
- Current stock and movements, or daily stock if you keep it.
- Promotions and price changes with their dates.
- A table of products that replace others.
- Lead times for each supplier, to know how many weeks ahead to forecast.
What does it not do?
It does not predict what has never happened. A large new customer, a shop opening in a city with no history or a price change nobody mentions: there the system leans on similar cases and says so, with a wider range. If you know something that is not in the data, we note it and it enters the calculation.
It does not replace the person who decides either. The forecast feeds the shipment proposal, and that proposal is approved or changed by a person. Nor does it write to your software without permission: it reads with a read-only user.
How is it tested and how do we start?
The test is the backtest: the system forecasts your past weeks again, using only what was known each week, and compares with what was sold and with a simple baseline. We measure weighted error in units, bias (whether it sits consistently above or below) and whether the range delivers what it promises. The time series cross-validation principle applies: the training set contains only observations prior to the one being forecast.
Then one or two months in shadow mode, with fresh data. If you want a preview, send us an export of sales and stock and we return which products ran out, for how many days and how much sales were hidden behind that. The demo lasts 30 minutes by video call, in English or Spanish.
Frequently asked questions
How is this different from forecasting in Excel?
Three things. It forecasts each product at each location separately instead of splitting a total. It produces a range, not a single figure, and uses it to calculate stockout risk. And it learns from the whole catalogue at once, so products with little history benefit from their family's seasonality. Your Excel is useful as the baseline the system is measured against.
What kind of AI does it use?
Machine-learning models trained on all product-location series together, combined with statistical methods for items with little history or sporadic sales. Which combination is used for you is decided with your history, not beforehand.
What is the band next to each forecast?
The interval where sales should fall with a given probability. If the forecast is 14 and the 80% band runs from 9 to 21, eight weeks out of ten sales fall inside it. It is used to decide how much safety margin each product needs.
Our sales are very seasonal. Does it cope?
Yes. It learns seasonality by region and product family. With two full seasons in the history the curve is fine; with one, it leans more on the family and the range is wider. Moving dates such as Easter are treated as dates, not fixed weeks.
How do you forecast a product that sells twice a year?
With a method for sporadic demand: it estimates how often it sells and how many units when it does, and from that the probability of a sale before the supplier can deliver. A weekly average of 0.04 does not help decide anything.
Do you need our customers' data?
No. Product, location, date and quantity sold, stock or its movements, and promotion dates are enough. If your export mixes in names or addresses, they are removed before anything is loaded.
Does the forecast place orders on its own?
No. It feeds the weekly shipment proposal, and a person approves or changes it. If a quantity is changed repeatedly, the system asks whether there is something it does not know, such as a new customer or a closure.
Sources
- International Journal of Forecasting, vol. 38(4), 2022: the M5 accuracy competition, results and findings
- Hyndman and Athanasopoulos, Forecasting: Principles and Practice (3rd ed.): prediction intervals
- Hyndman and Athanasopoulos, Forecasting: Principles and Practice (3rd ed.): forecasting count data and Croston's method
- Hyndman and Athanasopoulos, Forecasting: Principles and Practice (3rd ed.): time series cross-validation