Inventory replenishment with AI: every week, what to send to each location, how much and why.
For companies that replenish many shops, customers, vans or warehouses and still decide it with a spreadsheet and a good memory. Our system reads sales and stock from the software you already run, calculates the risk of running out of each product at each location, and proposes the week's shipments. A person approves or changes them. You can test it on your own history before you sign anything.
Book a 30-minute demoHow it works
Read-only connection · Tested on your own data first · Data hosted in the EU · Demos in English or Spanish
The short answer
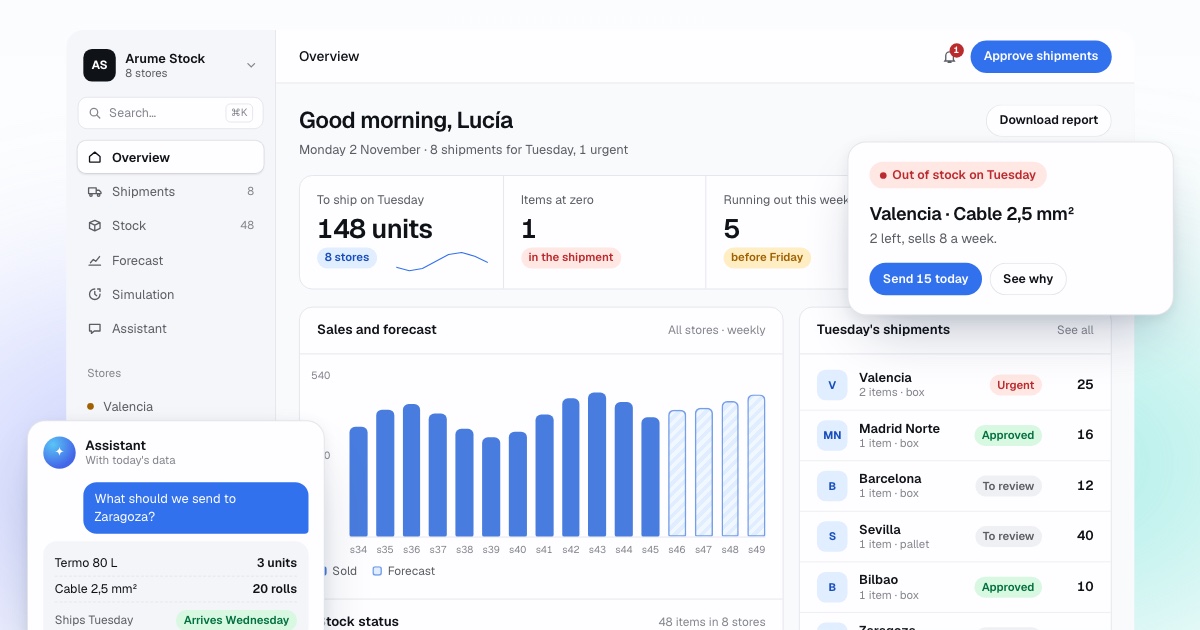
AI inventory replenishment software forecasts demand for each product at each location, calculates the risk of a stockout before the next delivery can arrive, and proposes what to send, how much and when, with the reason for every line. Arume's system reads sales and stock from your ERP with a read-only user, a person approves each proposal, and it is tested on your historical data before you commit. It suits companies that restock many shops, customers, vans or warehouses.
By Manuel Gómez González, founder of Arume · Reviewed on
What it does
A weekly list of shipments, with the reason
Every Monday (or every other day in peak season) the system proposes what to send to each location and how much. Each line carries a one-sentence explanation: recent sales, stock today, what is already on its way, supplier lead time and the risk of running out. Nobody has to trust a black box.
Risk of stockout, not a fixed minimum
A rule such as "reorder when stock falls below ten" treats a product that sells three a day like one that sells three a month. We forecast each product at each location as a range and calculate the probability of reaching zero before the next delivery. You set the risk you accept per product family.
Read-only connection to your software
We connect to Odoo, Microsoft Dynamics 365 Business Central, Sage, Holded, SAP Business One, Shopify, WooCommerce, PrestaShop, Power BI or a plain Excel or CSV export, with a user that can only read. Nothing is written back to your ERP without a person approving it.
An assistant you can question
Ask "how much is left in Lyon?", "why are you sending 15?" or "what if I send two fewer?". It answers with your data and says where each figure comes from. If it does not have the data, it says so.
A dashboard for the person who decides
A stock map by location (at zero, running out, fine, overstocked), the forecast by week with its range, and the value of slow-moving stock in euros.
Alerts on WhatsApp, if you want them
An add-on built with our partner Bedel: urgent alerts, the Monday shipping list with buttons, and questions to the assistant from a phone.
Tested before you sign
We replay your past weeks using only what was known on each day and compare what the system would have sent with what you actually did. Then one or two months in shadow mode with fresh data.
What is AI inventory replenishment software?
It is software that decides how much of each product to send to each location, and when, using forecasts learned from your sales history instead of a fixed minimum and maximum. Its output is not a report about stock. It is a list of actions for the coming week, with the reason for each one.
It is not an ERP. It does not invoice, issue delivery notes or keep your accounts. It sits on top of the ERP you already have, reads sales and stock, and returns a proposal. That distinction matters in practice: you keep your processes, your users and your data model, and replenishment gets the specialised calculation that an ERP module rarely does well.
It is also not a chatbot that guesses. A language model is used in one place only, the assistant that understands questions and writes answers. The figures themselves come from queries on your data and from statistical and machine-learning forecasts that are measured before they are used.
How is replenishment usually decided in a multi-location business?
In most companies we see, it is a mix of an ERP reorder rule that was set during implementation and the judgement of one or two people who know the business. The rule says "minimum 10, maximum 20". The person corrects it from memory: this shop sells more in September, that supplier is late in August, this product is about to be discontinued. It works while that person is there and the business resembles the one the rule was written for.
It breaks in three places. Seasonality: a single coefficient for all shops, when the same product family peaks two or three weeks earlier on the coast than inland. Products with little history: a new item looks as if it does not sell because it has been on the shelf for a month. And stockouts: the days a shop sat at zero are recorded as zero sales, so the system learns that the product sells less than it really does, and the shop stays short.
The result is the familiar pattern of too much stock in one place and none in another, with an urgent transfer or an express order in between.
How does the system decide what to send?
For each product at each location it forecasts demand for the days until the next delivery can arrive, as a range: "most likely six units, with a 10% chance of more than eleven". From that range it calculates the probability of hitting zero before replenishment, using the real lead time of that supplier or route.
It then checks whether sending is worth it, in money: what would be sold against the cost of the shipment and of the stock sitting on the shelf. If the risk exceeds the level you set and the shipment pays for itself, the line goes on the list, with the quantity that covers demand up to the next delivery at your chosen service level. If a shipment is already going to that location, it fills in the other products that are running short.
The forecasting method matters less than the way it is checked. In the M5 forecasting competition, teams had to predict 42,840 series of Walmart unit sales by product, store and state. Models that learn from all series together did best, but the results also showed that complicated methods can lose to simple ones when they are not validated properly. So our models are always measured against a simple baseline on your own history, and where the baseline wins for a group of products, the baseline is used for that group.
- Demand as a range, not one number: the stockout risk comes from it.
- Real lead time per supplier and per destination.
- Service level and risk threshold that you set, different in peak season and off season.
- Cost of shipping and of stock sitting idle, so shipments that do not pay are not proposed.
- A confidence marker on each forecast: a new product or a location with two months of history is flagged as such.
What data do you need from us?
Sales by product and location with dates, today's stock, and the movements in and out so we can rebuild what the stock was on each past day. Almost nobody stores daily stock, and it is not needed: it is reconstructed backwards from today's stock and the movements. That reconstruction is the first thing we do, because it shows which days a product was not sold because it was not there.
We take the data as it comes: an Excel export, reports from Odoo or Holded, orders from Shopify. Before calculating anything we hand you a data quality report: how many sales there are, which products have no reference, which movements do not add up. That report alone usually finds something.
You do not need to share customer data. To forecast stock, date, product, location and quantity are enough. Names, emails and addresses are not loaded.
Which software does it connect to?
It reads from Odoo, Microsoft Dynamics 365 Business Central, Sage, Holded, SAP Business One, Shopify, WooCommerce, PrestaShop, Power BI, or an Excel or CSV file. The connection uses a user with read-only permissions. The Odoo documentation is explicit about why that matters: an API key gives the same access as the user account it belongs to, so the safe route is a user that can only read.
If your software is something else, we look at it during the diagnosis. Almost every management system can export sales and stock one way or another, and an export is a perfectly good starting point.
How is it tested before we sign?
We run what is called a backtest. For a period you know well, the system decides again, week by week, using only data available on each date, starting from the stock you really had. We then compare three histories of the same period: what you did, what the system would have done, and what a simple rule would have done. The measures are fixed before anyone looks at results: days at zero stock, units in excess, number of shipments, demand served and idle stock in euros.
The principle is the one forecasting textbooks describe as time series cross-validation: the training set contains only observations that occurred before the one being forecast. If the system does not beat your own decisions, the report says so and the conversation ends there. The report is yours either way.
After the backtest comes shadow mode: one or two months in which the system proposes every week, your team decides as usual, and at the end we compare again. Nobody knows the future, so nothing can be tuned to a known result.
When is it not worth it?
If you have one warehouse, few references, a supplier that delivers in 24 hours and no seasonality, a well-set reorder point in your ERP is enough, and we will tell you so in the diagnosis. It starts to pay when several of these come together: many locations, marked seasonality, long supplier lead times, shipments that cost money, products that expire or get stuck, and someone who spends hours every week deciding by eye.
It is also weaker with little history. With fewer than six months of sales it can start, but with a low confidence that is shown on every line. In that case the honest route is simple rules first, and letting the model learn while the business sells.
How do we start?
Set-up takes three to six weeks from the first export to a system running on your data, hosted in the European Union with daily backups and a full export if you ever leave. The first step costs you half an hour: a video demo, in English or Spanish, on a sample company with eight locations. If you then want to see it on your numbers, send us an export of sales and stock and we return a short report with the products that ran out, for how many days, and what is sitting idle.
Frequently asked questions
Does it replace our ERP?
No. Your ERP keeps invoicing, delivery notes and accounting. The system reads sales and stock from it with a read-only user and returns a replenishment proposal. If you have no management software at all, a spreadsheet is enough as a data source.
Does the system place orders by itself?
No. A person on your team approves each weekly proposal and can change any line. The changes are recorded and help tune the model. Full automation is possible, but few companies want it, and almost none at the start.
How much history do we need?
One year of sales is enough to start. With two seasons the seasonal pattern is clearer and the forecast ranges narrow. With less, the system borrows what product families have in common and marks the confidence as low.
How do we know the forecasts are any good?
We measure them on your history before using them, against a simple baseline and against what you did. We also check that the stated risk is the real one: when the system says there is a 10% risk of running out, it should happen about one time in ten.
Which ERPs and shop platforms do you connect to?
Odoo, Microsoft Dynamics 365 Business Central, Sage, Holded, SAP Business One, Shopify, WooCommerce, PrestaShop, Power BI and Excel or CSV files. Others are assessed in the diagnosis.
Where is our data kept?
On servers in the European Union, with daily backups. Customer data is not needed and is not loaded. If you leave, you can take a full export and we delete the rest.
Do you work with companies outside Spain?
Yes. We are a software development and web design company based in Spain and we work remotely. Demos and documentation are available in English or Spanish.
With the software you already use
By industry
The system, piece by piece
Sources
- International Journal of Forecasting, vol. 38(4), 2022: the M5 accuracy competition, results and findings
- Hyndman and Athanasopoulos, Forecasting: Principles and Practice (3rd ed.): prediction intervals
- Hyndman and Athanasopoulos, Forecasting: Principles and Practice (3rd ed.): time series cross-validation
- Odoo 18: External API and API keys