Predictive analytics for inventory means one thing: knowing what will run out, where, before it does.
Predictive analytics covers a lot of ground, from customer churn to maintenance. On this page it means the part that matters to a company that moves product: forecasting sales, stock and replenishment. We explain what it is, what it needs from your data, how to tell a useful model from a decorative one, and where it stops being useful.
Book a 30-minute demoHow it works
Read-only connection · Tested on your own data first · Data hosted in the EU · Demos in English or Spanish
The short answer
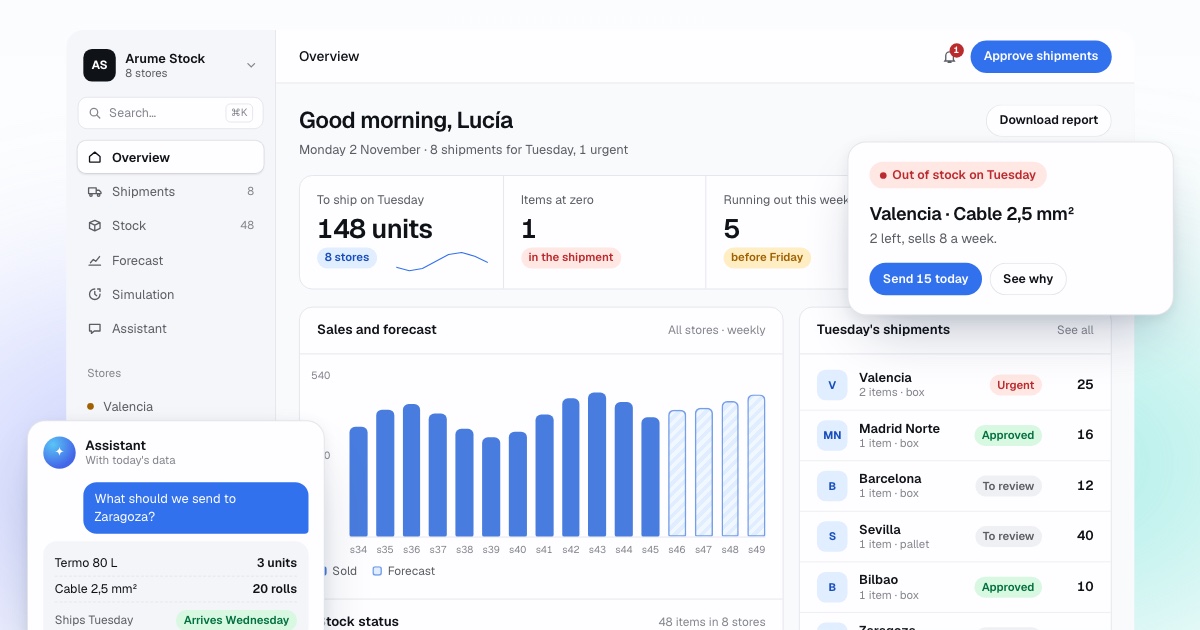
Predictive analytics for inventory uses past sales, stock and delivery times to estimate what will sell, where and when, and the probability of running out. It is applied to replenishment decisions: which product to send to which location, how much and when. It is not churn prediction, marketing scoring or HR analytics. Arume applies it on top of your ERP with read-only access and checks it with a backtest on your own history first.
By Manuel Gómez González, founder of Arume · Reviewed on
What it does
Forecast by product and location
Predictive analytics applied to sales: not the company total but each product at each shop, depot or customer, week by week.
Uncertainty measured, not hidden
Every forecast carries a range. The range is what turns a prediction into a decision: how much margin each product needs.
From prediction to action
The analysis ends in a weekly list of shipments with the reason for each, which a person approves. A chart nobody acts on has no value.
Overstock as well as stockouts
The same models show where stock is piling up: slow-moving units and their value in euros, so that you stop sending to places that do not need it.
Works on your existing software
Odoo, Business Central, Sage, Holded, SAP Business One, Shopify, WooCommerce, PrestaShop, Power BI or Excel. We read; we do not replace.
Validated before use
Backtest on your past weeks, calibration of the ranges and one or two months in shadow mode.
What is predictive analytics?
Predictive analytics is a set of statistical methods, drawn from data mining, predictive modelling and machine learning, that analyse current and past data to make predictions about future or otherwise unknown events. Its toolkit includes regression, time series models such as ARIMA and exponential smoothing, and machine-learning models that score each case by likelihood.
In a business that moves product, it answers three practical questions: how much of each product will be sold, how likely it is that a location runs out before its next delivery, and what to send to avoid it without piling up stock elsewhere. That is the scope of this page. We are not talking about predicting which customers will leave, which leads will convert or which employees will resign: they use the same family of methods, but they are different projects with different data.
What is predictive analytics used for in inventory management?
There are four uses that justify the work, in order of how often they pay off. Demand forecasting by product and location. Stockout risk, which combines the forecast with stock, deliveries on the way and supplier lead time. Replenishment quantities: how much to send, to bring that risk below the level you accept. And detection of dead stock, by comparing what a location holds with what it is expected to sell.
In retail and distribution the value lies at the level of the pair product-and-location. A chain of 40 shops with 3,000 products has 120,000 such pairs, and nobody reviews that many every week with a spreadsheet. Predictive analytics does the first pass on all of them and puts in front of the person the few dozen lines that need a decision, each with its reason.
It is not a magic switch. Our Replenishment study 2026, an open simulation of 1,200 synthetic sales series, found that forecast-based replenishment needed 25 % less stock than fixed cover and 42 % less than a fixed minimum to serve 95 % of demand for seasonal products with a four-week lead time, and that with steady demand and a short lead time a well-tuned fixed cover did just as well. The data are synthetic and public, not a customer result.
What data does predictive analytics need?
Less than people fear and more than they usually have clean. The essentials are sales by product, location and date; stock today and its movements; supplier lead times; and the dates of promotions and price changes. A year of history is the practical minimum, two is better because seasonality is then seen twice.
The usual problems are not the model but the data: duplicate product codes, a product that replaced another and lost its history, locations with gaps in their records, and days when stock was zero and sales therefore look like "no demand". That last one is called censored demand, and ignoring it makes every forecast too low for the products that run out most. Before modelling anything we deliver a data quality report listing these cases.
- Sales by product, location and day or week.
- Stock today and in/out movements, to rebuild the days with no product.
- Lead time of each supplier.
- Promotions, price changes and product replacements, with their dates.
How do you tell a useful model from a decorative one?
By what it has been tested against. A model that looks sophisticated and has never been compared with a simple rule tells you nothing. Three tests separate them. Does it beat a baseline? A moving average of the last weeks is the usual one, and the model must do better on data it has not seen. Was it tested without peeking? In time series cross-validation, the training set contains only observations before the one being forecast; anything else flatters the result. Are its ranges honest? For an 80 % interval, the real value should fall outside it about 20 % of the time.
We report all three on your history in the backtest, then run one or two months in shadow mode with fresh data. Where the model does not beat the baseline for a group of products, we use the baseline for that group and say so.
How does it connect with Power BI or the ERP you already have?
Predictive analytics does not need a new system of record. We read from your ERP or shop platform with a user that can only read, calculate outside it, and show the result in a dashboard or send it to the person who decides. If you already use Power BI, it can be where the forecast and the stock map are displayed: Power BI shows, our system calculates. The model itself does not live inside a report.
Writing back, for example creating a draft transfer, is optional, agreed case by case and always after approval by a person.
Where does it stop being useful?
When there is no history to learn from: a new business, a new product line with no comparable family, or a market that has just changed. When the problem is the supplier and not the forecast, because a delivery that arrives in three weeks one time and nine the next cannot be forecast away. And when the data is not trustworthy, because stock levels in the ERP are not updated.
In each of these cases we say it in the first conversation or after the backtest. A prediction that cannot be validated is not offered as a result.
How do we start?
With a 30-minute video demo, in English or Spanish, and then a simulation with your own data: we replay your past weeks and compare what the system would have sent with what you did. Set-up takes three to six weeks and data is hosted in the EU. For the engine itself, see the AI stock predictor and demand forecasting pages.
Frequently asked questions
Is predictive analytics the same as AI?
Not exactly. Predictive analytics is the goal, predicting future events from data; AI and machine learning are one family of methods for doing it, alongside classical statistics such as exponential smoothing or ARIMA. We use both and choose by what wins on your history.
Do you cover churn, marketing or HR predictions?
No. Here we apply predictive analytics only to sales, stock and replenishment.
How much history do we need?
One year is enough to start and two is better, because the model sees each season twice. With less, it relies on what product families share and flags lower confidence.
Can it run on top of Power BI?
Yes in the sense that Power BI can display the results. The forecasting is calculated by our system outside the report, because Power BI is built to show data, not to place orders or train models for stock.
How do I know the predictions are reliable?
Through a backtest on your past weeks, a calibration table of the ranges and one or two months in shadow mode. You see the error and the bias before using any proposal.
Is it only for large companies?
It is for companies that replenish many locations, customers or vans, where the number of product-location pairs is too big to review by hand. The number of employees matters less than that.