Your Power BI shows what happened. We add what to order.
For companies that already have an inventory report in Power BI, with turnover, days of cover and stock-outs, and want it to say how much to order of each product and when. We calculate the forecast and the purchase proposal outside, from the same sources your report already reads, and publish them as tables in your model. Your report stays yours, with three more pages.
Book a 30-minute demoHow it works
Read-only connection · Tested on your own data first · Data hosted in the EU · Demos in English or Spanish
The short answer
A Power BI inventory dashboard shows turnover, cover and stock-outs, but it does not decide what to buy. We add the missing step: a forecast and a purchase proposal calculated outside Power BI, from the same sources your report already reads, and published as tables in your own model. The report gains three pages (what to order this week, stock-out risk, forecast versus actual) without being rebuilt, and each inventory metric gets one written definition.
By Manuel Gómez González, founder of Arume · Reviewed on
What it does
What your report already shows
Stock value by warehouse and family, turnover, days of cover, items with no movement, stock-outs of the month, sales against last year. It refreshes on its own and each person sees what they should. We do not touch it.
It shows, it does not decide
A report says cover is 12 days and the supplier takes 20, and stops there. The forecast on a line chart is one curve per series, with no stock, no lead time and no money. And Power BI does not write anywhere: nobody places an order from a chart.
Calculated outside, returned as tables
The engine reads the same sources, calculates demand, stock-out risk and order quantity per product and warehouse, and writes the result to tables in your database or in a source Power BI already refreshes. Your model loads them like any other source.
Three new pages
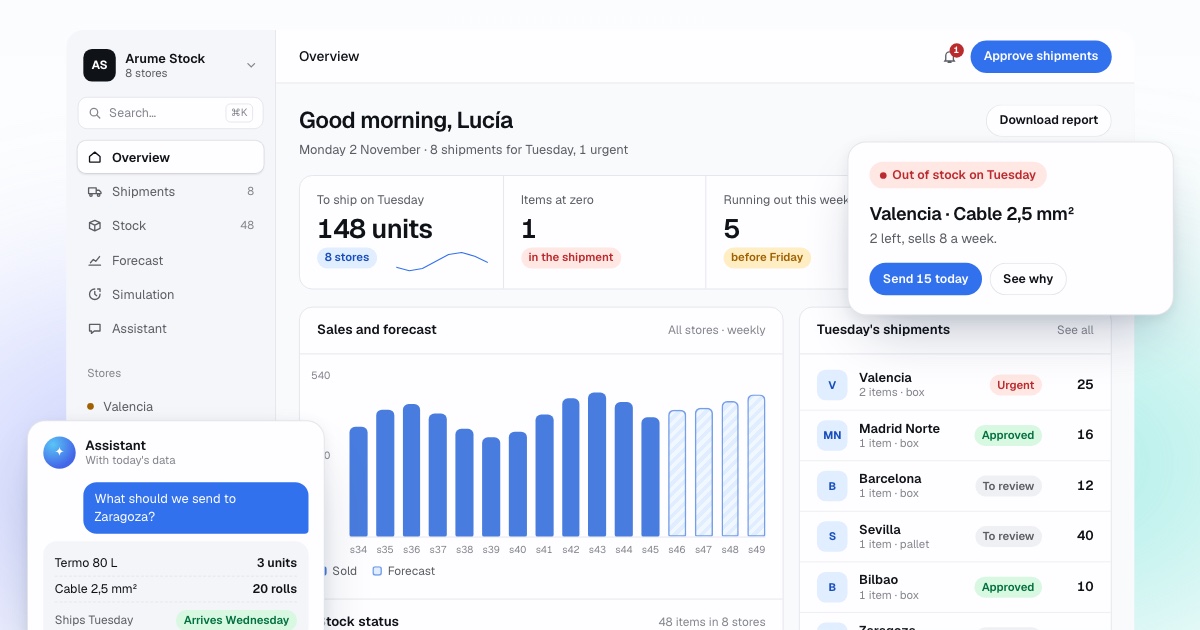
What to order this week, sorted by what you lose if you do not order. Stock-out risk, product by product and warehouse by warehouse. And forecast versus actual, to see each month where the model was wrong. With your theme, filters and permissions.
One definition per indicator
Turnover, cover, service level, stock-outs, dead stock in money and forecast accuracy, each with a written definition and one formula, so Purchasing, Management and Finance read the same number.
The proposal also leaves the dashboard
Seeing the list in Power BI is useful; ordering happens in the ERP. The same proposal can be left in the ERP as a draft purchase order, or in a sheet per supplier, and alerts can reach buyers by email or Teams.
What does an inventory dashboard in Power BI do, and what does it not?
A good inventory report in Power BI shows in a few clicks what used to take a morning in Excel: stock value by warehouse and family, turnover, days of cover, items with no movement in six months, stock-outs, sales against last year. It reads from the ERP, a database or spreadsheets in SharePoint, refreshes overnight, and each user sees their own scope.
What it does not do is decide. The Analytics pane can add a forecast to a line chart, and Microsoft documents that this feature is available only for line charts, with settings such as forecast length and confidence interval. It projects one series forward. It does not know today's stock, what is on its way, the supplier lead time or the cost of a shipment. With 2,000 products in 15 warehouses you have 30,000 series, not one.
How do you go from "12 days of cover" to "order 36 boxes on Tuesday"?
Cover in days is stock divided by average sales. Take a product with 600 units in stock and average sales of 50 a day: cover is 12 days. Your supplier takes 20. That is a good warning, but not a decision.
To decide you need demand over those days as a range. Suppose the season pushes expected demand over the next 20 days to 1,300 units, and a safety margin of 150 covers the upside. You need 1,300 plus 150, minus the 600 you hold, minus nothing in transit: 850 units. If the supplier sells in boxes of 24, you order 36 boxes, which is 864 units. The engine does this per product and warehouse, and the result is a list with the quantity and one sentence of reasoning, not a chart.
How does it enter your Power BI: as tables, not another dashboard?
The engine does not replace Power BI or add another screen to open. It calculates outside, in your infrastructure or ours, and writes tables: forecast by product, warehouse and week; stock-out risk; the purchase proposal with its reasoning; forecast versus actual. The tables go to your database, an Azure data warehouse, Fabric if you have it, or files in the SharePoint folder your report already reads. The only requirement is a source that scheduled refresh already picks up.
In the model, the new tables relate to the product and warehouse tables you already have, so existing filters, hierarchies and permissions work on them. If a consultant built your report and nobody wants to rebuild it, nothing needs rebuilding. If the consultant is still around, we work together.
The sources stay the same. If Power BI already reads from Sage, Odoo or a database, the engine uses that same connection or export. We do not ask for a second way into your company.
What are the three pages added to the report?
The first is what to order this week: products and warehouses with the proposed quantity, sorted by what you lose if you do not order, with filters for supplier, warehouse and family. It is the Purchasing page and it is designed so that the order comes out of it.
The second is stock-out risk: for each product and warehouse, the probability of reaching zero before the next order arrives, at the level you set. You see at a glance what is red and why, and also the opposite: products with so much stock that there is no risk for months, which is cash tied up.
The third is forecast versus actual: each month and campaign, what the model expected and what happened, by country, family or warehouse. It is the Management page, and it is what makes the model open to challenge.
How do we check it before publishing a single table?
Before anything appears in your report, the engine takes an exam on your own past months: it decides again each week using only what was known that week, starting from the stock you really had, and we compare with what you did. The measures are fixed before we see the result: demand served, lost sales in money, orders, units and cash tied up.
The figures from that simulation are what the forecast versus actual page shows, including where the model fails. Then one or two months in shadow mode: the order page is published every week, you order as usual, and at the end we measure what would have happened.
When is your dashboard enough?
With one warehouse, a few hundred products and suppliers that deliver in a few days, a dashboard with days of cover and a reorder-point rule in the ERP is plenty. Adding a forecast would only complicate it, and we will tell you so.
It pays off when the dashboard already shows the problem but not the exit: many points of sale or warehouses, a marked season, slow suppliers, costly shipments, and a Monday meeting that ends with "so what do we order?". Send an export of sales and stock and we return a free analysis.
Frequently asked questions
Do I have to rebuild my Power BI report?
No. The new tables enter your model as one more source and relate to the product and warehouse tables you already have. The new pages are added to the existing report, in your theme.
Can Power BI do the forecast on its own?
For one series on a chart, yes: the Analytics pane can add a forecast to a line chart. To decide how much to order of 2,000 products in 15 warehouses, with supplier lead times, current stock and goods on order, no. That is a separate calculation, and Power BI is very good at displaying its result.
Where are the calculated tables stored?
Where you decide: your database, an Azure data warehouse, a Fabric lakehouse, or files in SharePoint if that is what your Power BI already uses. The data stays in your infrastructure.
Does it refresh by itself?
Yes. The engine calculates every week, or every two days in campaign, and the scheduled refresh of Power BI picks up the tables. If something fails, you are warned.
Our Power BI reads Excel, not a database. Does it work?
Yes. We read those same spreadsheets and leave the output tables as files in the same SharePoint or OneDrive folder. It is not the most elegant set-up, but it needs nothing new. When you want a database, we change the destination.
Who maintains what?
Normally your data team or consultant keeps the model and report, and we keep the engine as part of maintenance. The engine only writes tables, so the boundary is clear, and the code is yours.